Touch and changeToca y cambia
Move, type, tap, or drag in the model. Watch what changes.Mueve, escribe, toca o arrastra en el modelo. Observa qué cambia.
Unit 8 · 6.DS.3
Shape of Data Distributions · Lesson 8-7
English: Use the pictures and short steps. Ask questions; let your student do the thinking. Español: Usen los dibujos y los pasos cortos. Hagan preguntas; dejen que su estudiante piense.
Tonight we describe the shape of a data picture: is it symmetric, skewed to one side, or does it have clusters and gaps?
Esta noche describimos la forma de un dibujo de datos: ¿es simétrico, sesgado hacia un lado, o tiene agrupamientos y huecos?
Follow the picture pathSigan la ruta visual
Real example, bar heights from left to right: 2, 5, 8, 5, 2.
Ejemplo real, alturas de barras de izquierda a derecha: 2, 5, 8, 5, 2.
The bars rise to a peak in the middle and fall evenly on both sides.
Las barras suben a un pico en el medio y bajan igual en ambos lados.
Both sides look like mirror images, so this shape is symmetric.
Ambos lados se ven como imágenes de espejo, así que esta forma es simétrica.
Next example, bar heights: 9, 6, 3, 1.
Siguiente ejemplo, alturas de barras: 9, 6, 3, 1.
The tallest bars are on the left and the bars get shorter going right.
Las barras más altas están a la izquierda y se hacen más cortas hacia la derecha.
The long tail points to the right, so this shape is skewed right.
La cola larga apunta a la derecha, así que esta forma está sesgada a la derecha.
Name the skew after the tail, not the peak.
Nombra el sesgo según la cola, no el pico.
Listen for "simétrico" — it means the two sides look about the same, like a mirror.
Escucha "simétrico" — significa que los dos lados se ven casi iguales, como un espejo.
Listen for "sesgado" — it means the data leans to one side with a long tail. The skew is named for the tail's direction.
Escucha "sesgado" — significa que los datos se inclinan a un lado con una cola larga. El sesgo se nombra por la dirección de la cola.
Ask your student to find the tail first. The direction the tail points names the skew.
Pídele a tu estudiante que encuentre la cola primero. La dirección a la que apunta la cola nombra el sesgo.
Use the same interactive model from the lesson. Change it, notice the pattern, and explain what the model shows.Usa el mismo modelo interactivo de la lección. Cámbialo, observa el patrón y explica lo que muestra.
Move, type, tap, or drag in the model. Watch what changes.Mueve, escribe, toca o arrastra en el modelo. Observa qué cambia.
Record one equation, value, or relationship you can see.Escribe una ecuación, un valor o una relación que puedas ver.
I notice ___ changes when ___ changes. This shows ___.Noto que ___ cambia cuando ___ cambia. Esto muestra ___.
Symmetric data mirrors around the center; skewed data has a long tail, and the skew is named for the direction the tail points.
A quick, no-timer review game for tonight's lesson — sort, match, and choose. A wrong answer just gives a hint and lets your student try again. Un juego de repaso sin reloj para la lección de hoy — clasificar, emparejar y elegir. Si se equivocan, reciben una pista y pueden intentar de nuevo.
↗ Play full screen ↗ Jugar en pantalla completa
Tap a card to flip. Use these words when you talk about the math together. Toquen una tarjeta para voltearla. Usen estas palabras cuando hablen de la matemática juntos.
Forma de las distribuciones de datos
The overall pattern of data, such as symmetric, skewed, clustered, or containing gaps.
El patrón general de los datos, como simétrico, sesgado, agrupado o con espacios.
📌 A long tail to the right means the distribution is skewed right.
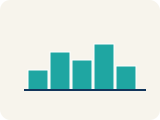
Simétrico
Data that looks about the same on the left and right.
Datos que se ven casi iguales a la izquierda y a la derecha.
📌 Heights: 60, 62, 64, 66, 68, 66, 64, 62, 60 — rises and falls evenly like a hill
Sesgado
When most data sits on one side with a tail on the other.
Cuando la mayoría de los datos está de un lado con una cola del otro.
📌 Skewed right: most data low (1,2,2,3,3,3,15) — tail stretches toward the high value
Agrupamiento
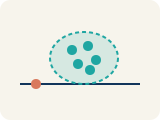
A group of numbers that are close together.
Un grupo de números que están cerca unos de otros.
📌 Scores 18, 19, 20, 21, 22 form a cluster around 20 — they are tightly grouped
Hueco (espacio)
A big empty space where there is no data.
Un espacio grande y vacío donde no hay datos.
📌 Data: 5, 6, 7, 8, ___, ___, ___, 20 — the empty space from 9 to 19 is a gap
Distribución de datos
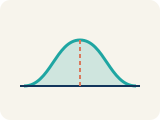
How the data looks: where it sits and how spread out it is.
Cómo se ven los datos: dónde están y qué tan separados están.
📌 Looking at a dot plot or histogram, you can see if data is symmetric, skewed, clustered, or has gaps
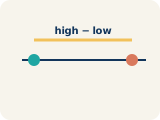
Variabilidad
How spread out the numbers are.
Qué tan separados están los números.
📌 Symmetric data with low variability: tightly packed around the center. Skewed data: spread unevenly
Imagine you are looking at two data pictures from the season. First, bar heights 1, 3, 6, 9.
Imaginen que miran dos dibujos de datos de la temporada. Primero, alturas de barras 1, 3, 6, 9.
Work side by side. You ask questions; your student does the thinking. Trabajen juntos. Tú haces preguntas; tu estudiante piensa.
Where are the tallest bars, and which way does the tail point?
¿Dónde están las barras más altas, y hacia qué lado apunta la cola?
Since the tail points left, is this symmetric, skewed right, or skewed left?
Como la cola apunta a la izquierda, ¿es simétrico, sesgado a la derecha o sesgado a la izquierda?
Now picture bar heights 2, 6, 6, 2. Do both sides match? What shape is that?
Ahora imaginen las alturas de barras 2, 6, 6, 2. ¿Coinciden los dos lados? ¿Qué forma es esa?
Do these together. Start at ★ and climb to ★★★ when ready. Háganlos juntos. Empiecen en ★ y suban a ★★★ cuando estén listos.
A histogram of basketball players' ages shows: most players are 22–28, with a long tail of older players up to age 40. What is the shape of this distribution?
A. Skewed right
A data set is symmetric. What is likely true about the mean and median?
A. They are approximately equal
A dot plot of goals scored per game shows: 0(5 dots), 1(7 dots), 2(4 dots), 3(2 dots), 4(1 dot). What is the shape?
A. Skewed right — most values at the low end with a tail to the right
A histogram has a long tail of high values stretching to the right. What is its shape?
A. Skewed right
A teacher shows two dot plots of quiz scores from two different classes. Class A's data is symmetric with a cluster around 80. Class B's data is skewed right with most scores between 60–70 and a few scores near 100. Compare the classes: which has a higher median? Which has a higher mean? In which class does the mean better represent a typical score?
⏱️ Plan on about 15–20 minutes for the 6 problems below. The extra practice at the bottom is optional. ⏱️ Calculen unos 15–20 minutos para los 6 problemas de abajo. La práctica extra al final es opcional.
A few problems to practice together. Each one has a step-by-step guide, a picture to draw on, and a space to show your work. Use Check This Problem for instant feedback — no need to finish everything at once. Unos problemas para practicar juntos. Cada uno tiene una guía paso a paso, un dibujo para trabajar y un espacio para mostrar el trabajo. Usen Revisar esta pregunta para retroalimentación al instante — no tienen que terminar todo de una vez.
Easier problems to practice the idea. Do these first together. Problemas más fáciles para practicar la idea. Hagan estos primero juntos.
Sort each described sports display into the shape feature it shows best.Clasifica cada representación deportiva descrita según la característica de forma que muestra mejor.
👪 On a phone, use Move to. On a computer, drag cards or tap a card then tap a column.👪 En el teléfono usen Mover a. En la computadora arrastren o toquen tarjeta y columna.
💡 Five different features are in play: symmetry, two skew directions, a gap, and a cluster. Read each description for the one detail that gives it away.Hay cinco características en juego: la simetría, las dos direcciones de sesgo, un espacio vacío y una agrupación. Lee cada descripción buscando el detalle que la delata.
💡 Ask three questions per card: does the data mirror itself around a center, does a long tail stretch one direction, or is there an empty stretch or a tight bunch?Hazte tres preguntas por tarjeta: ¿los datos se reflejan alrededor de un centro?, ¿hay una cola larga que se estira hacia un lado?, ¿o hay un tramo vacío o un grupo muy apretado?
💡 Try the race times card: there is a group at 12s and another at 20s with nothing from 13 to 19. Decide what that empty stretch is called, then work through the rest.Prueba con la tarjeta de los tiempos de carrera: hay un grupo en 12 s y otro en 20 s, sin nada entre 13 y 19. Decide cómo se llama ese tramo vacío y luego sigue con las demás.
A dot plot has one peak in the middle and even sides. What shape is it?Un diagrama de puntos tiene un solo pico en el centro y lados parejos. ¿Qué forma tiene?
👪 Read the question together, then let your student pick an answer before you discuss why.👪 Lean la pregunta juntos; dejen que su estudiante elija antes de hablar del porqué.
A histogram: most players are at 70-85%, a gap sits at 50-65%, and a few are at 40-50%. Name the shape and features.Un histograma: la mayoría de los jugadores está en 70-85%, hay una brecha en 50-65% y unos pocos están en 40-50%. Nombra la forma y sus características.
👪 Read the question together, then let your student pick an answer before you discuss why.👪 Lean la pregunta juntos; dejen que su estudiante elija antes de hablar del porqué.
Try these once the warm-up feels easy. It's okay to use the steps and pictures. Intenten estos cuando el calentamiento sea fácil. Está bien usar los pasos y los dibujos.
A teacher shows two dot plots of quiz scores from two different classes. Class A's data is symmetric with a cluster around 80. Class B's data is skewed right with most scores between 60–70 and a few scores near 100. Compare the classes: which has a higher median? Which has a higher mean? In which class does the mean better represent a typical score?Un maestro muestra dos diagramas de puntos con los puntajes de dos grupos distintos. Los datos del grupo A son simétricos con un grupo alrededor de 80. Los datos del grupo B están sesgados a la derecha, con la mayoría de los puntajes entre 60 y 70 y algunos cerca de 100. Compara los grupos: ¿cuál tiene la mediana más alta? ¿Cuál tiene la media más alta? ¿En cuál grupo representa mejor la media un puntaje típico?
👪 A complete sentence with math vocabulary is the goal — not a perfect paragraph.👪 Una oración completa con vocabulario matemático es la meta — no un párrafo perfecto.
A dot plot of goals scored per game shows: 0(5 dots), 1(7 dots), 2(4 dots), 3(2 dots), 4(1 dot). What is the shape?Un diagrama de puntos de goles anotados por partido muestra: 0 (5 puntos), 1 (7 puntos), 2 (4 puntos), 3 (2 puntos), 4 (1 punto). ¿Cuál es la forma?
👪 Read the question together, then let your student pick an answer before you discuss why.👪 Lean la pregunta juntos; dejen que su estudiante elija antes de hablar del porqué.
Display 4: Match each feature you spot in a data display to the term that names it.Representación 4: Une cada característica que detectes en una representación de datos con el término que la nombra.
👪 Say each term out loud, then talk through which match makes sense before choosing.👪 Digan cada término en voz alta y hablen de cuál pareja tiene sentido antes de elegir.
Optional. Only if your student wants more — these are bonus problems. Opcional. Solo si tu estudiante quiere más — son problemas adicionales.
A histogram of basketball players' ages shows: most players are 22–28, with a long tail of older players up to age 40. What is the shape of this distribution?Un histograma de las edades de jugadores de baloncesto muestra que la mayoría tiene entre 22 y 28 años, con una cola larga de jugadores mayores hasta los 40 años. ¿Cuál es la forma de esta distribución?
👪 Read the question together, then let your student pick an answer before you discuss why.👪 Lean la pregunta juntos; dejen que su estudiante elija antes de hablar del porqué.
Match each distribution shape to how its mean and median compare.Une cada forma de distribución con la comparación entre su media y su mediana.
👪 Say each term out loud, then talk through which match makes sense before choosing.👪 Digan cada término en voz alta y hablen de cuál pareja tiene sentido antes de elegir.
Sort each data set by its likely histogram shape.Clasifica cada conjunto de datos según la forma probable de su histograma.
👪 On a phone, use Move to. On a computer, drag cards or tap a card then tap a column.👪 En el teléfono usen Mover a. En la computadora arrastren o toquen tarjeta y columna.
💡 Symmetric: most values cluster in the middle with equal tails on both sides.Simétrica: la mayoría de los valores se agrupan en el medio con colas iguales a ambos lados.
💡 Skewed RIGHT: a few very HIGH values (e.g., superstar earnings) stretch the tail right.Asimétrica a la DERECHA: unos pocos valores muy ALTOS (por ejemplo, ganancias de estrellas) estiran la cola a la derecha.
💡 Skewed LEFT: a few very LOW values (e.g., a few bad rounds) stretch the tail left.Asimétrica a la IZQUIERDA: unos pocos valores muy BAJOS (por ejemplo, unas pocas rondas malas) estiran la cola a la izquierda.
A histogram has a long tail of high values stretching to the right. What is its shape?Un histograma tiene una cola larga de valores altos que se extiende hacia la derecha. ¿Cuál es su forma?
👪 Read the question together, then let your student pick an answer before you discuss why.👪 Lean la pregunta juntos; dejen que su estudiante elija antes de hablar del porqué.
Sort each bar pattern into the correct distribution shape.Clasifica cada patrón de barras en la forma de distribución correcta.
👪 On a phone, use Move to. On a computer, drag cards or tap a card then tap a column.👪 En el teléfono usen Mover a. En la computadora arrastren o toquen tarjeta y columna.
💡 Symmetric: bars rise and fall evenly from the center. The pattern mirrors itself.Simétrica: las barras suben y bajan de manera pareja desde el centro. El patrón se refleja a sí mismo.
💡 Skewed right: tallest bars on the left, trailing off to the right. Skewed left: opposite.Asimétrica a la derecha: barras más altas a la izquierda que van bajando hacia la derecha. Asimétrica a la izquierda: al revés.
Classify each data set by its distribution shape.Clasifica cada conjunto de datos según la forma de su distribución.
👪 On a phone, use Move to. On a computer, drag cards or tap a card then tap a column.👪 En el teléfono usen Mover a. En la computadora arrastren o toquen tarjeta y columna.
💡 Look for outliers or tails. A high outlier creates a right skew. A low outlier creates a left skew.Busca valores atípicos o colas. Un atípico alto crea asimetría a la derecha. Un atípico bajo crea asimetría a la izquierda.
💡 If data is roughly even on both sides of the center, it is symmetric.Si los datos están más o menos parejos a ambos lados del centro, son simétricos.
Which word describes the direction of the TAIL, not the peak?¿Cuál palabra describe la dirección de la COLA, no del pico?
👪 Read the question together, then let your student pick an answer before you discuss why.👪 Lean la pregunta juntos; dejen que su estudiante elija antes de hablar del porqué.
A data set is symmetric. What is likely true about the mean and median?Un conjunto de datos es simétrico. ¿Qué es probable que sea cierto sobre la media y la mediana?
👪 Read the question together, then let your student pick an answer before you discuss why.👪 Lean la pregunta juntos; dejen que su estudiante elija antes de hablar del porqué.
A digital scratch pad to draw models, line up decimals, and show your work. It opens in a new tab so you keep your place on this homework. Una pizarra digital para dibujar modelos, alinear decimales y mostrar el trabajo. Se abre en una pestaña nueva para no perder tu lugar en esta tarea.
🧮 Open the Math Workbench ↗ 🧮 Abrir la Pizarra de matemáticas ↗
Where is the long tail? Which way does it point?
¿Dónde está la cola larga? ¿Hacia qué lado apunta?
Do the left and right sides look about the same?
¿Los lados izquierdo y derecho se ven casi iguales?
Is there a big empty space (a gap) anywhere in the data?
¿Hay un espacio grande y vacío (un hueco) en algún lugar de los datos?
Name the skew after the side with the tallest bars.
Nombra el sesgo según el lado con las barras más altas.
If the data has a tall peak, it is always symmetric.
Si los datos tienen un pico alto, siempre es simétrico.
A gap in the data does not matter when you describe the shape.
Un hueco en los datos no importa cuando describes la forma.
These links go to specific videos and lessons about tonight's topic — not general math pages. Estos enlaces van a videos y lecciones específicas sobre el tema de hoy — no páginas generales.
Reinforce tonight's topic with a quick family game. You ask; your student decides! Refuercen el tema de hoy con un juego rápido en familia. ¡Ustedes preguntan; su estudiante decide!
🎮 Play together! Statistical questions expect many different answers from a group. 🎮 ¡Jueguen juntos! Las preguntas estadísticas esperan muchas respuestas diferentes de un grupo.
High five! Whether every answer was perfect or not, you showed up for your student tonight. That matters.
¡Chócalas! No importa si cada respuesta fue perfecta — estuviste con tu estudiante esta noche. Eso importa.
Answers save automatically on this device. Tap Check This Problem anytime. Las respuestas se guardan solas en este dispositivo. Toquen Revisar esta pregunta cuando quieran.
Signed on:Firmado el:
Note to teacher / Nota para el maestro:
This certifies that the homework for was completed and reviewed collaboratively.
Parent/Guardian Signature
Date